Final 2018 IndyCar TV Results
 |
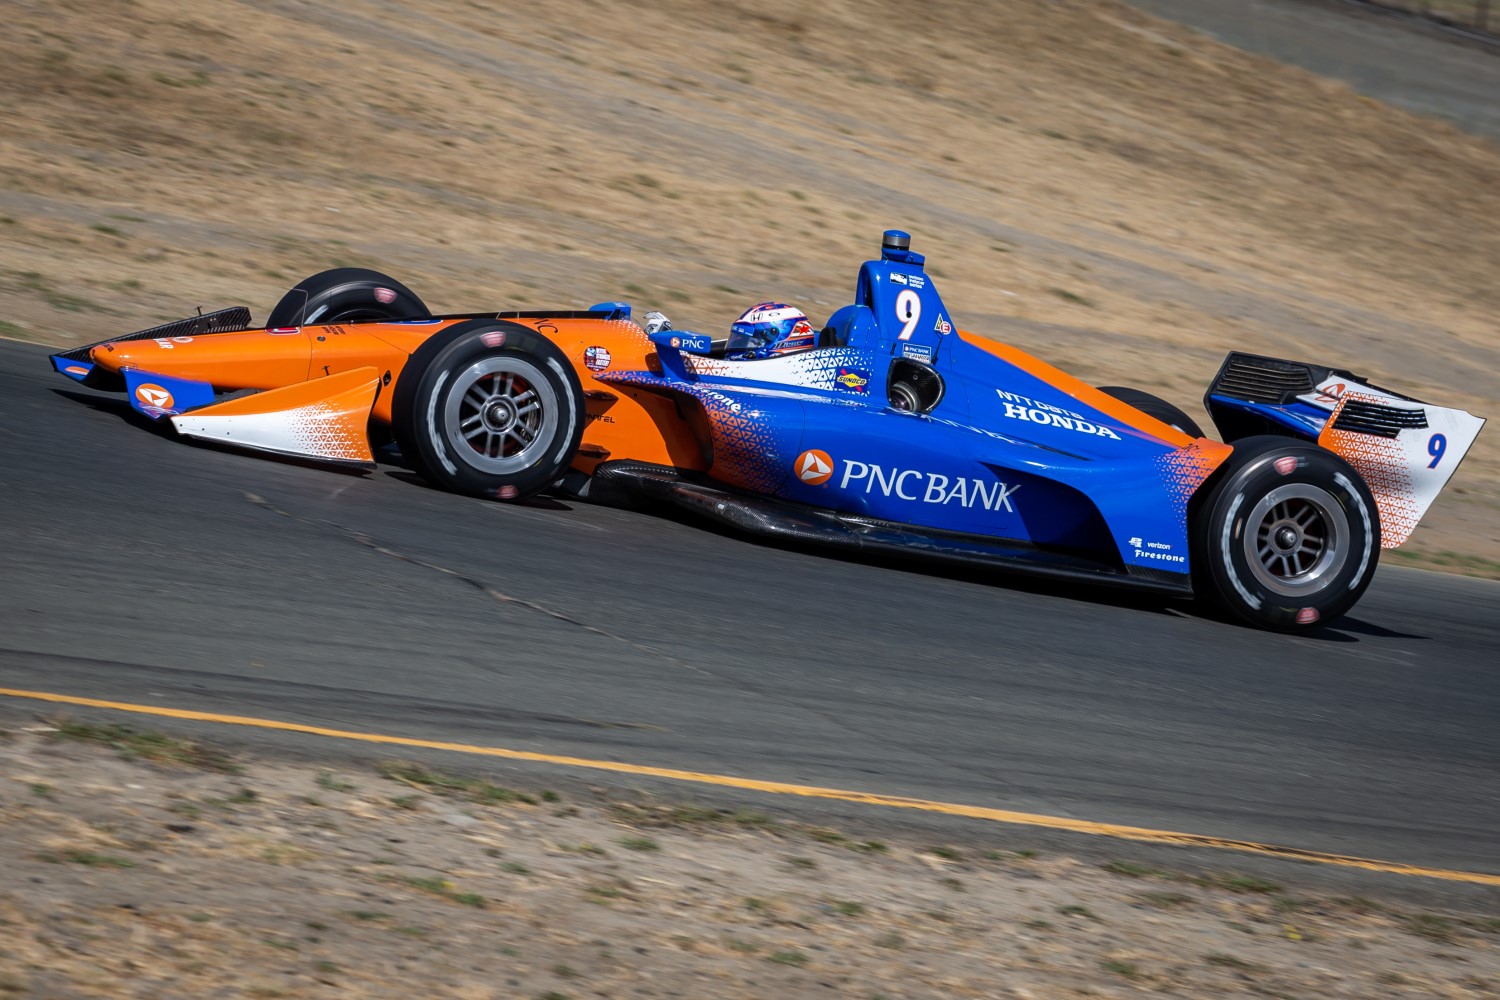
| Scott Dixon |
IndyCar pulled in 14.2 million viewers for 2018, down 2 million from 2017. By comparison F1 averages around 50 million per race globally.
Hopefully the rumors are true that Liberty wants to buy the series and the speedway. If they use their international TV contacts and can significantly increase IndyCar's global viewership, IndyCar sponsor deals will sky rocket and the series will be on solid footing again.
| Venue | 2016 Network |
2016 Rating |
2016 Viewers |
201 Rating |
2017 Viewers |
2018 Rating |
2018 Viewers |
| St. Petersburg | ABC | 1 | 1,400,000 | 0.8 | 1,190,000 | 0.81 | 1,144,000 |
| Phoenix | NBCSN | 0.29 | 363,000 | 0.21 | 343,000 | 0.19 | 253,000 |
| Long Beach | NBCSN | 0.37 | 402,000 | 0.21 | 321,000 | 0.24 | 370,000 |
| Barber | NBCSN | 0.26 | 279,000 | 0.39 | 470,000 | <0.20 | 310,000 |
| Indy GP | ABC | 1 | 1,300,000 | 0.7 | 1,000,000 | 0.8 | 1,140,000 |
| Indy 500 | ABC | 3.9 | 6,000,000 | 3.4 | 5,500,000 | 3.1 | 4,900,000 |
| Detroit 1 | ABC | 0.7 | 1,000,000 | 0.6 | 847,000 | 0.55 | 751,000 |
| Detroit 2 | ABC | 0.6 | 918,000 | 0.9 | 1,400,000 | 0.6 | 936,000 |
| Texas | NBCSN | 0.3 | 388,000 | 0.35 | 561,000 | 0.21 | 336,000 |
| Elkhart Lake | NBCSN | 0.33 | 470,000 | 0.37 | 568,000 | 0.22 | 322,000 |
| Iowa | NBCSN | 0.37 | 534,000 | 0.37 | 534,000 | 0.31 | 452,000 |
| Toronto | CNBC | 171,000 | 187,000 | ||||
| Toronto | NBCSN SDD | 0.3 | 530,000 | 0.32 | 489,000 | 0.29 | 458,000 |
| Mid-Ohio | NBCSN | 0.55 | 811,000 | 0.39 | 576,000 | 0.39 | 644,000 |
| Mid-Ohio | NBCSN | 0.13 | 200,000 | 0.09 | 139,000 | ||
| Pocono | NBCSN | 0.45 | 635,000 | 0.4 | 618,000 | 0.34 | 542,000 |
| Gateway | NBCSN | 0.23 | 359,000 | 0.23 | 391,000 | ||
| Watkins Glen | NBCSN | 0.29 | 440,000 | 0.41 | 604,000 | ||
| Portland | NBCSN | 0.35 | 529,000 | ||||
| Sonoma | NBCSN | 0.33 | 528,000 | 0.33 | 536,000 | 0.38 | 629,000 |
| Total | 16,169,000 | 16,303,000 | 14,246,000 | ||||
| % Chg | 0.8% | % Chg | -14.4% | ||||
| '16 to '17 | +134,000 | '17 to '18 | -2,057,000 |
