Viewership for IndyCar down in 2020 if you include Indy 500 (Update)
Historical IndyCar TV Ratings
| Venue | 2016 Network | 2016 Rating | 2016 Viewers | 2017 Network | 2017 Rating | 2017 Viewers | 2018 Network | 2018 Rating | 2018 Viewers | 2019 Network | 2019 Rating | 2019 Viewers | 2020 Network | 2020 Rating | 2020 Viewers |
| St. Pete | ABC | 1 | 1,400,000 | ABC | 0.8 | 1,190,000 | ABC | 0.81 | 1,144,000 | NBCSN | 0.32 | 495,000 | NBC | 0.41 | 671,000 |
| Phoenix | NBCSN | 0.29 | 363,000 | NBCSN | 0.21 | 343,000 | NBCSN | 0.19 | 253,000 | – | – | – | – | – | – |
| Austin | – | – | – | – | – | – | – | – | – | NBCSN | 0.23 | 341,000 | – | – | – |
| Barber | NBCSN | 0.26 | 279,000 | NBCSN | 0.39 | 470,000 | NBCSN | 0.2 | 310,000 | NBCSN | 0.19 | 296,000 | – | – | – |
| Long Beach | NBCSN | 0.37 | 402,000 | NBCSN | 0.21 | 321,000 | NBCSN | 0.24 | 370,000 | NBCSN | 0.28 | 436,000 | – | – | – |
| Indy GP | ABC | 1 | 1,300,000 | ABC | 0.7 | 1,000,000 | ABC | 0.55 | 780,000 | NBC | 0.71 | 1,066,000 | NBC | 0.77 | 1,139,000 |
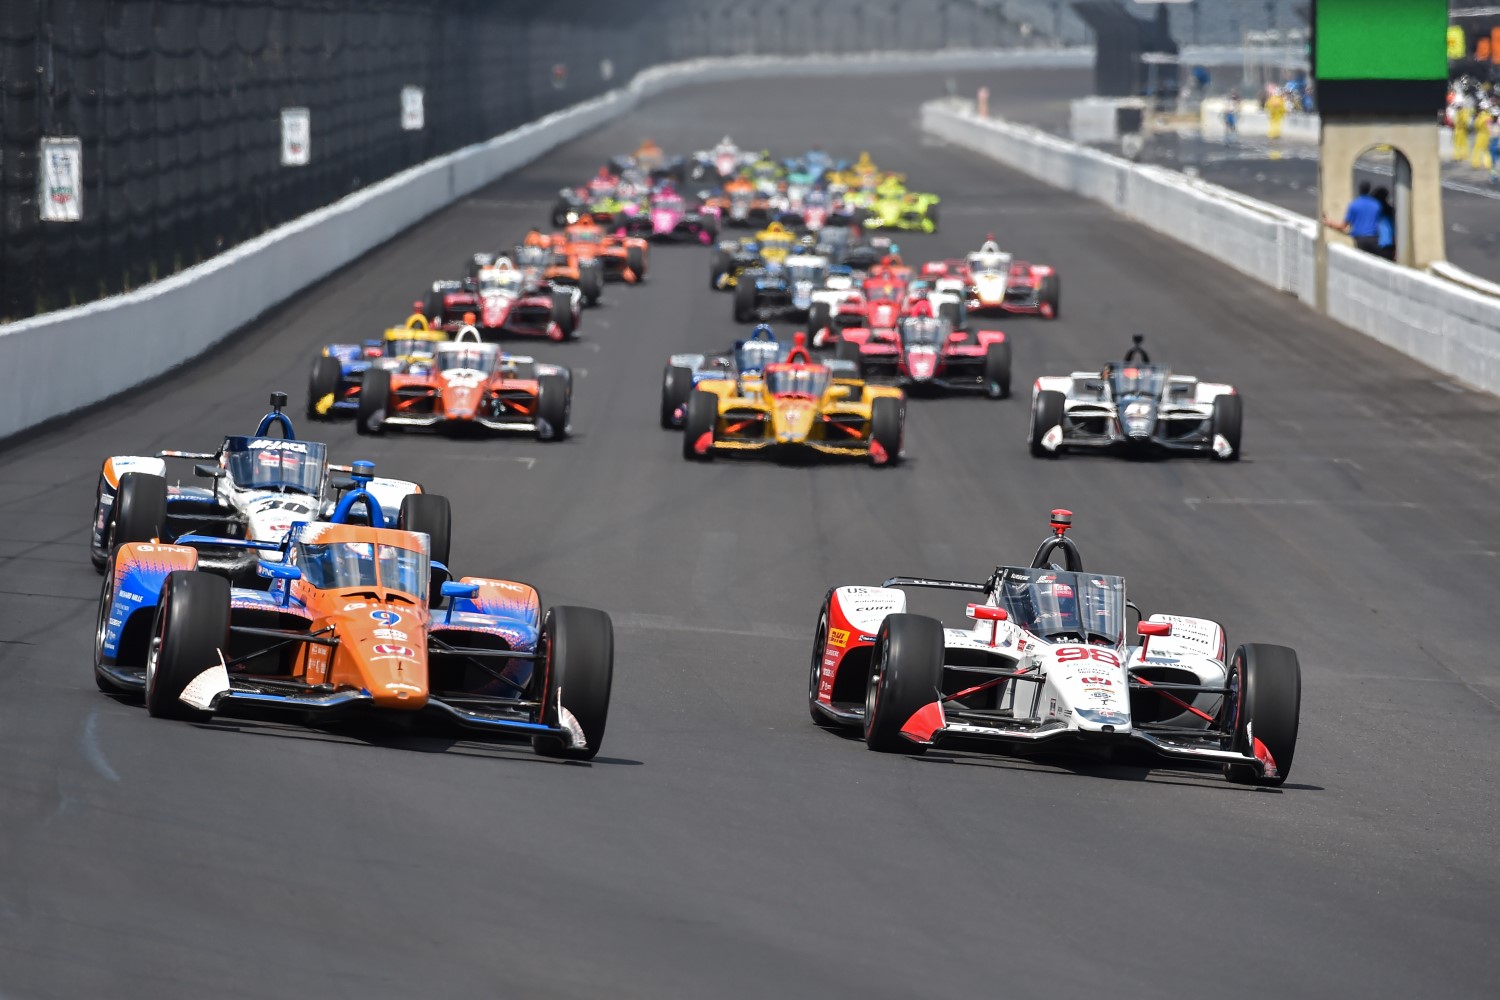
| Indy 500 | ABC | 3.9 | 6,000,000 | ABC | 3.4 | 5,500,000 | ABC | 3.1 | 4,900,000 | NBC | 3.40 | 5,400,000 | NBC | 2.30 | 3,737,000 |
| Detroit1 | ABC | 0.7 | 1,000,000 | ABC | 0.6 | 847,000 | ABC | 0.55 | 751,000 | NBC | 0.55 | 761,000 | – | – | – |
| Detroit 2 | ABC | 0.6 | 918,000 | ABC | 0.9 | 1,400,000 | ABC | 0.63 | 936,000 | NBC | 0.71 | 1,091,000 | – | – | – |
| Texas | NBCSN | 0.3 | 388,000 | NBCSN | 0.35 | 561,000 | NBCSN | 0.21 | 336,000 | NBCSN | 0.24 | 366,000 | NBC | 0.80 | 1,249,000 |
| Elkhart Lake1 | NBCSN | 0.33 | 470,000 | NBCSN | 0.37 | 568,000 | NBCSN | 0.22 | 322,000 | – | – | – | NBCSN | 0.18 | 299,000 |
| Elkhart Lake2 | – | – | – | – | – | – | – | – | – | NBC | 0.77 | 1,104,000 | NBC | 0.72 | 1,050,000 |
| Toronto | CNBC | – | 171,000 | CNBC (live) | – | 187,000 | – | – | – | – | – | – | – | – | – |
| Toronto | NBCSN (delay) | 0.3 | 530,000 | NBCSN (delay) | 0.32 | 489,000 | NBCSN | 0.29 | 458,000 | NBCSN | 0.33 | 502,000 | – | – | – |
| Iowa1 | NBCSN | 0.37 | 534,000 | NBCSN | 0.37 | 534,000 | NBCSN | 0.31 | 452,000 | NBCSN | 0.11 | 156,000 | NBCSN | 0.21 | 334,000 |
| Iowa2 | – | – | – | – | – | – | – | – | – | – | – | – | NBCSN | 0.23 | 356,000 |
| Mid-Ohio | NBCSN | 0.55 | 811,000 | NBCSN (delay) | 0.39 | 576,000 | NBCSN (delay) | 0.39 | 644,000 | NBC | 0.47 | 670,000 | NBC | 0.44 | 635,000 |
| Mid-Ohio | – | – | – | CNBC (live) | 0.13 | 200,000 | CNBC (live) | 0.09 | 139,000 | – | – | – | NBCSN | 0.38 | 624,000 |
| Pocono | NBCSN | 0.45 | 635,000 | NBCSN | 0.4 | 618,000 | NBCSN | 0.34 | 542,000 | NBCSN | 0.36 | 549,000 | – | – | – |
| Gateway | – | – | – | NBCSN | 0.23 | 359,000 | NBCSN | 0.23 | 391,000 | NBCSN | 0.20 | 310,000 | NBCSN | 0.37 | 569,000 |
| Watkins Glen | NBCSN | 0.29 | 440,000 | NBCSN | 0.41 | 604,000 | – | – | – | – | – | – | – | – | – |
| Portland | – | – | – | – | – | NBCSN | 0.35 | 529,000 | NBC | 0.74 | 1,101,000 | – | – | – | |
| Sonoma | NBCSN | 0.33 | 528,000 | NBCSN | 0.33 | 536,000 | NBCSN | 0.38 | 629,000 | – | – | – | – | – | – |
| Harvest GP1 | – | – | – | – | – | – | – | – | – | – | – | – | USA Net | 0.14 | 221,000 |
| Harvest GP2 | – | – | – | – | – | – | – | – | – | – | – | – | NBC | 0.37 | 816,000 |
| Laguna Seca | – | – | – | – | – | – | – | – | – | NBC | 0.50 | 732,000 | – | – | – |
| Annual Total | 16,169,000 | 16,303,000 | 13,886,000 | 15,376,000 | 11,700,000 |
October 27, 2020
Despite extraordinary circumstances caused by the COVID-19 pandemic, the NTT INDYCAR SERIES concluded its 14-race 2020 season on Sunday with solid year-over-year viewership across NBC, NBCSN, USA Network and NBC Sports digital platforms.
When excluding this year’s Indianapolis 500 — which took place in August instead of May for the first time ever — and a unique Friday afternoon race that aired on USA Network, the remaining 12 races (6 NBC; 6 NBCSN) averaged a Total Audience Delivery (TAD) of 664,000 viewers, up 2% vs. 2019 (15 races; 649,000). The six races on NBC averaged 891,000 viewers, while the six NBCSN races averaged 432,000 viewers, according to Official National data provided by The Nielsen Company and digital data from Adobe Analytics.
[Editor’s Note: When you include the Indy 500 and the Friday race on the USA Network, the ratings were down for 2020.]
This past Sunday’s season-concluding Firestone Grand Prix of St. Petersburg, in which Scott Dixon won his sixth career NTT INDYCAR SERIES championship, averaged a TAD of 675,000 viewers on NBC, up 6% and 18%, respectively, vs. two NBC races earlier this fall — Mid-Ohio (9/13; 639,000) and Harvest GP at IMS road course (10/3; 570,000).
The 2020 season was originally scheduled to begin on March 15 in St. Petersburg, but that race and numerous others were postponed due to the pandemic. After vigorous rescheduling, the season eventually began on June 6 at Texas Motor Speedway in prime time on NBC, which averaged a TAD of 1.256 million viewers to become NBC Sports’ most-watched INDYCAR race on record and the series’ most-watched race since 2016, excluding Indy 500s. It was the first of 14 total races in 2020 compared to 17 last year. NBC Sports Press Release