TV News: Weekend TV Ratings – Indy 500, NASCAR down, F1 up big (2nd Update)
More info on the horrible 2022 Indy 500 TV rating:
- NBC did everything it could to pump up the Indy 500 TV rating. They failed. The did a commercial campaign to a prime-time audience during the Winter Olympics in February. Helio Castroneves visited the ‘Today Show’. Following the Kentucky Derby NBC had Jimmie Johnson on to drum up mainstream audience awareness, trying to ride his NASCAR coattails. NBC then placed their golden boy Johnson on Jimmy Fallon’s ‘The Tonight Show’ during race week.
- The total viewers reported included all platforms – 4.8 million that includes linear TV, Peacock Premium and additional streaming through NBCSports.com.
- The chart below looks at the history of the Indy 500 TV ratings. It is clear who the one individual was that destroyed IndyCar and the Indy 500 TV ratings.
| Year | TV Rating | Share % USA Households Watching TV that are watching race |
Net | League | Comment |
| 1979 | 13.5 | 24 Share | ABC | CART | CART’s 1st Year |
| 1980 | 13.8 | 27 Share | ABC | CART | IndyCar’s Golden Years |
| 1981 | 12.8 | 24 Share | ABC | CART | IndyCar’s Golden Years |
| 1982 | 12.3 | 25 Share | ABC | CART | IndyCar’s Golden Years |
| 1983 | 14.1 | 27 Share | ABC | CART | IndyCar’s Golden Years |
| 1984 | 12.9 | 25 Share | ABC | CART | IndyCar’s Golden Years |
| 1985 | 9.7 | 18 Share | ABC | CART | IndyCar’s Golden Years |
| 1986 | 8.8 | 31 Share | ABC | CART | IndyCar’s Golden Years |
| 1987 | 11.1 | 36 Share | ABC | CART | IndyCar’s Golden Years |
| 1988 | 8.5 | 29 Share | ABC | CART | IndyCar’s Golden Years |
| 1989 | 7.8 | 28 Share | ABC | CART | IndyCar’s Golden Years |
| 1990 | 7.4 | 26 Share | ABC | CART | IndyCar’s Golden Years |
| 1991 | 8.0 | 27 Share | ABC | CART | IndyCar’s Golden Years |
| 1992 | 9.8 | 31 Share | ABC | CART | IndyCar’s Golden Years |
| 1993 | 9.3 | 31 Share | ABC | CART | IndyCar’s Golden Years |
| 1994 | 9.1 | 31 Share | ABC | CART | IndyCar’s Golden Years |
| 1995 | 9.4 | 26 Share | ABC | CART | IndyCar’s Golden Years |
| 1996 | 6.6 | 19 Share | ABC | IRL | T. George destruction begins |
| 1997 | 5.1 | 14 Share | ABC | IRL | Rating falls below 6.0 |
| 1998 | 6.0 | 19 Share | ABC | IRL | T. George damage continues |
| 1999 | 5.5 | 18 Share | ABC | IRL | T. George damage continues |
| 2000 | 5.5 | 15 Share | ABC | IRL | T. George damage continues |
| 2001 | 5.8 | 17 Share | ABC | IRL | T. George damage continues |
| 2002 | 4.8 | 15 Share | ABC | IRL | Rating falls below 5.0 |
| 2003 | 4.6 | 14 Share | ABC | IRL | T. George damage continues |
| 2004 | 4.7 | 11 Share | ABC | IRL | T. George damage continues |
| 2005 | 6.5 | 18 Share | ABC | IRL | Some CART Teams Participate |
| 2006 | 5.0 | 14 Share | ABC | IRL | T. George damage continues |
| 2007 | 4.3 | 12 Share | ABC | IRL | CART/IRL Merger deal done |
| 2008 | 4.5 | ?? Share | ABC | IRL | A small bump up after merger |
| 2009 | 4.0 | 11 Share | ABC | IRL | Merger can’t overcome T. George damage |
| Year | TV Rating | Viewers | Net | League | Comment |
| 2010 | 3.6 | 10 Share 5.79M | ABC | IRL | Rating falls below 4.0, <10% of Households |
| 2011 | 4.0 | 6.71M | ABC | IndyCar | T. George damage continues |
| 2012 | 4.34 | 6.86M | ABC | IndyCar | T. George damage continues |
| 2013 | 3.7 | 5.74M | ABC | IndyCar | Viewership falls below 6.0M |
| 2014 | 3.8 | 5.94M | ABC | IndyCar | T. George damage continues |
| 2015 | 4.1 | 6.4M | ABC | IndyCar | T. George damage continues |
| 2016 | 3.8 | 5.86M | ABC | IndyCar | T. George damage continues |
| 2017 | 3.41 | 5.457M | ABC | IndyCar | T. George damage continues |
| 2018 | 3.08 | 4.91M | ABC | IndyCar | T. George damage continues |
| 2019 | 3.41 | 5.414M + 32K Streaming | NBC | IndyCar | First Year for NBC, equals ABC in 2017 |
| 2020 | 2.26 | 3.669M | NBC | IndyCar | Down 32.3% |
| 2021 | 3.15 | 5.547M | NBC | IndyCar | Up 36.9%, there was hope |
| 2022 | 2.69 | 4.618M | NBC | IndyCar | Down 14.6%, back to reality |
June 1, 2022
The article below was updated with more detail.
June 1, 2022
Below is a summary of the USA TV ratings from this past weekend. See main analysis table below.
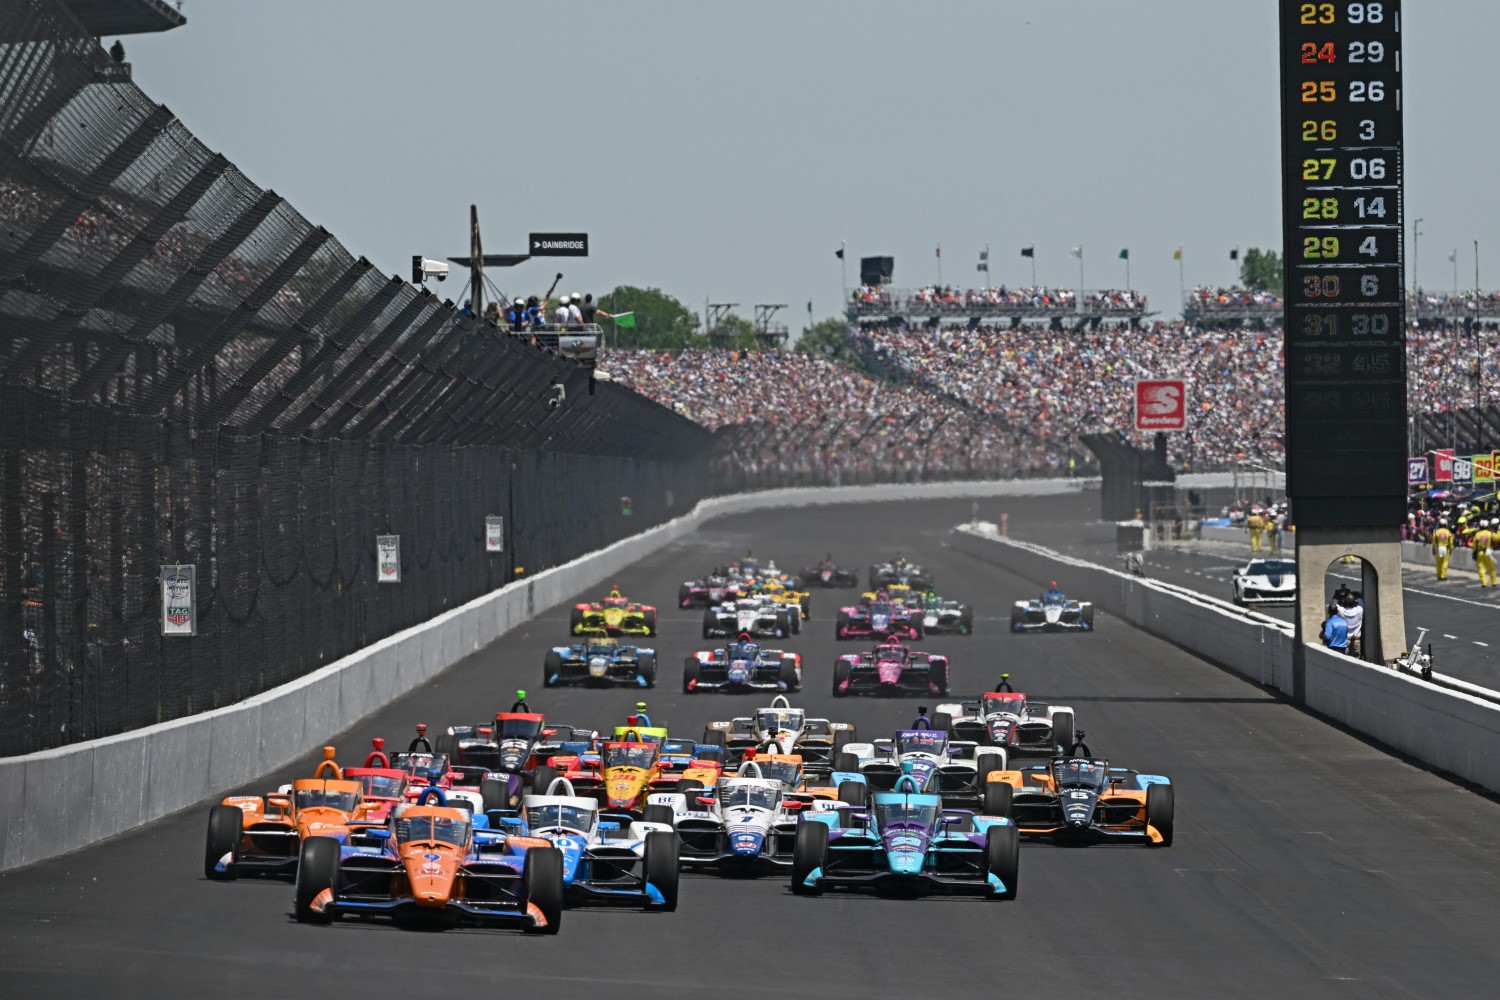
IndyCar -Indy 500: While attendance was up, the TV rating for the Indy 500 on NBC was a 2.69, down 14.6% from a 3.15 in 2021. The race lost 929,000 viewers from a year ago. This has to be concerning. When you lose almost 1 million viewers in one year, things are not good. Led by Peacock, it was the most streamed IndyCar race ever, a lowly 218,800 viewers. Nielsen has been measuring U.S. streaming since mid-2020, but the numbers reflect only viewing via a TV screen, which leaves out mobile, but not many will watch a 3-hour-long race on a smartphone. It also captures only four major services: Netflix, Amazon’s Prime Video, Disney+ and Hulu. The event was supposed to be blacked out on local television broadcasts in an effort to boost ticket sales, but all fans were able to watch on NBC’s streaming service, Peacock. NBC attempted to comply with the blackout but was unable to devise a technological solution to exclude a geographical area that small.
NASCAR – Coca-Cola 600: The TV rating for the NASCAR Coca-Cola 600 was a 2.20, down 3.51% from a 2.28 in 2021
Formula 1 – Monaco GP: The TV rating for the Monaco GP on ESPN was a 0.76, up 35.71% from a 0.56 in 2021. The viewership was up 43%. The replay on ABC in the afternoon drew 762,000 viewers for a total viewer count of 2.158 million. The race averaged 1.4 million viewers, the largest live cable audience for the race on record and the second most-viewed live telecast of the historic race ever. Viewership was up 43 percent over the 2021 edition of the race, which aired on ESPN2 and averaged 977,000 viewers.
Excluding the rain delay, the race telecast averaged 1.6 million viewers from 10 a.m. until noon ET as Mexico’s Sergio Pérez drove to victory. During the rain delay prior to the start of the race, 1.2 million were tuned in from 8:53 – 10 a.m. as they waited for action to start. The audience peaked at 1.8 million viewers in the 10:30-10:45 a.m. quarter hour.
What is more important is that the percent of viewers that were of prime age (18-49) that sponsors are looking for was a high of 43%, indicating once again that F1’s fan base is growing younger while IndyCar’s and NASCAR’s fan base ages out. On a percentage basis, F1 gets double the prime viewers vs IndyCar and NASCAR.
Over 75 million people watched the Monaco GP worldwide.
This year’s seasonal average of 1.4 million viewers is 45 percent larger than the 948,000 average through the first seven races of the 2021 season and up 45 percent over the 949,000 season-long average for 2021, which was the most-viewed F1 season ever on U.S. television.
ESPN’s Formula 1 telecasts also continue to attract younger viewers – the race averaged 595,000 viewers in the Persons ages 18-49 demographic, up 45 percent over last season’s race average of 411,000. ESPN was averaging 319,000 viewers per race in the Persons 12-34 age group through the first six races of the season, up 84 percent over the average of 174,000 for the first six races of 2021.
The top 10 local market ratings for the F1 race telecast:
| 1 | Greenville-Spartanburg, SC | 1.6 |
| 2 | Washington, DC | 1.5 |
| 3 | Richmond, VA | 1.5 |
| 4 | Hartford, CT | 1.4 |
| 5 | Fort Myers, FL | 1.4 |
| 6 | Tampa-St. Petersburg | 1.3 |
| 7 | Austin, TX | 1.3 |
| 8 | Tulsa, OK | 1.1 |
| 9 | Charlotte, NC | 1.1 |
| 10 | San Diego | 1.1 |
Weekend Ratings
| Network | Event | Location | Total Viewers | 18-49 Viewers | Ratio: 18-49 Yr Old /Total Viewers | 2022 TV Rating | 2021 TV Rating | %Chg |
| NBC | Indy 500 Race L | Indianapolis | 4,618,000 | 914,000 | 20% | 2.69 | 3.15 | -14.60% |
| FOX | NASCAR Coca-Cola 600 | Charlotte | 3,869,000 | 742,000 | 19% | 2.20 | 2.28 | -3.51% |
| ESPN | F1 Race L | Monaco | 1,396,000 | 595,000 | 43% | 0.76 | 0.56 | +35.71% |
| FS1 | NASCAR Xfinity Race | Charlotte | 767,000 | 153,000 | 20% | 0.46 | 0.59 | -22.03% |
| ABC | F1 Race Replay | Monaco | 762,000 | 185,000 | 24% | 0.45 | 0.45 | 0.00% |
| FS1 | NASCAR Truck Race L | Charlotte | 590,000 | 108,000 | 18% | 0.35 | 0.37 | -5.41% |
| FS1 | ARCA Race L | Charlotte | 263,000 | 55,000 | 21% | 0.16 | 0.26 | -38.46% |