Take A Number: 38
 |
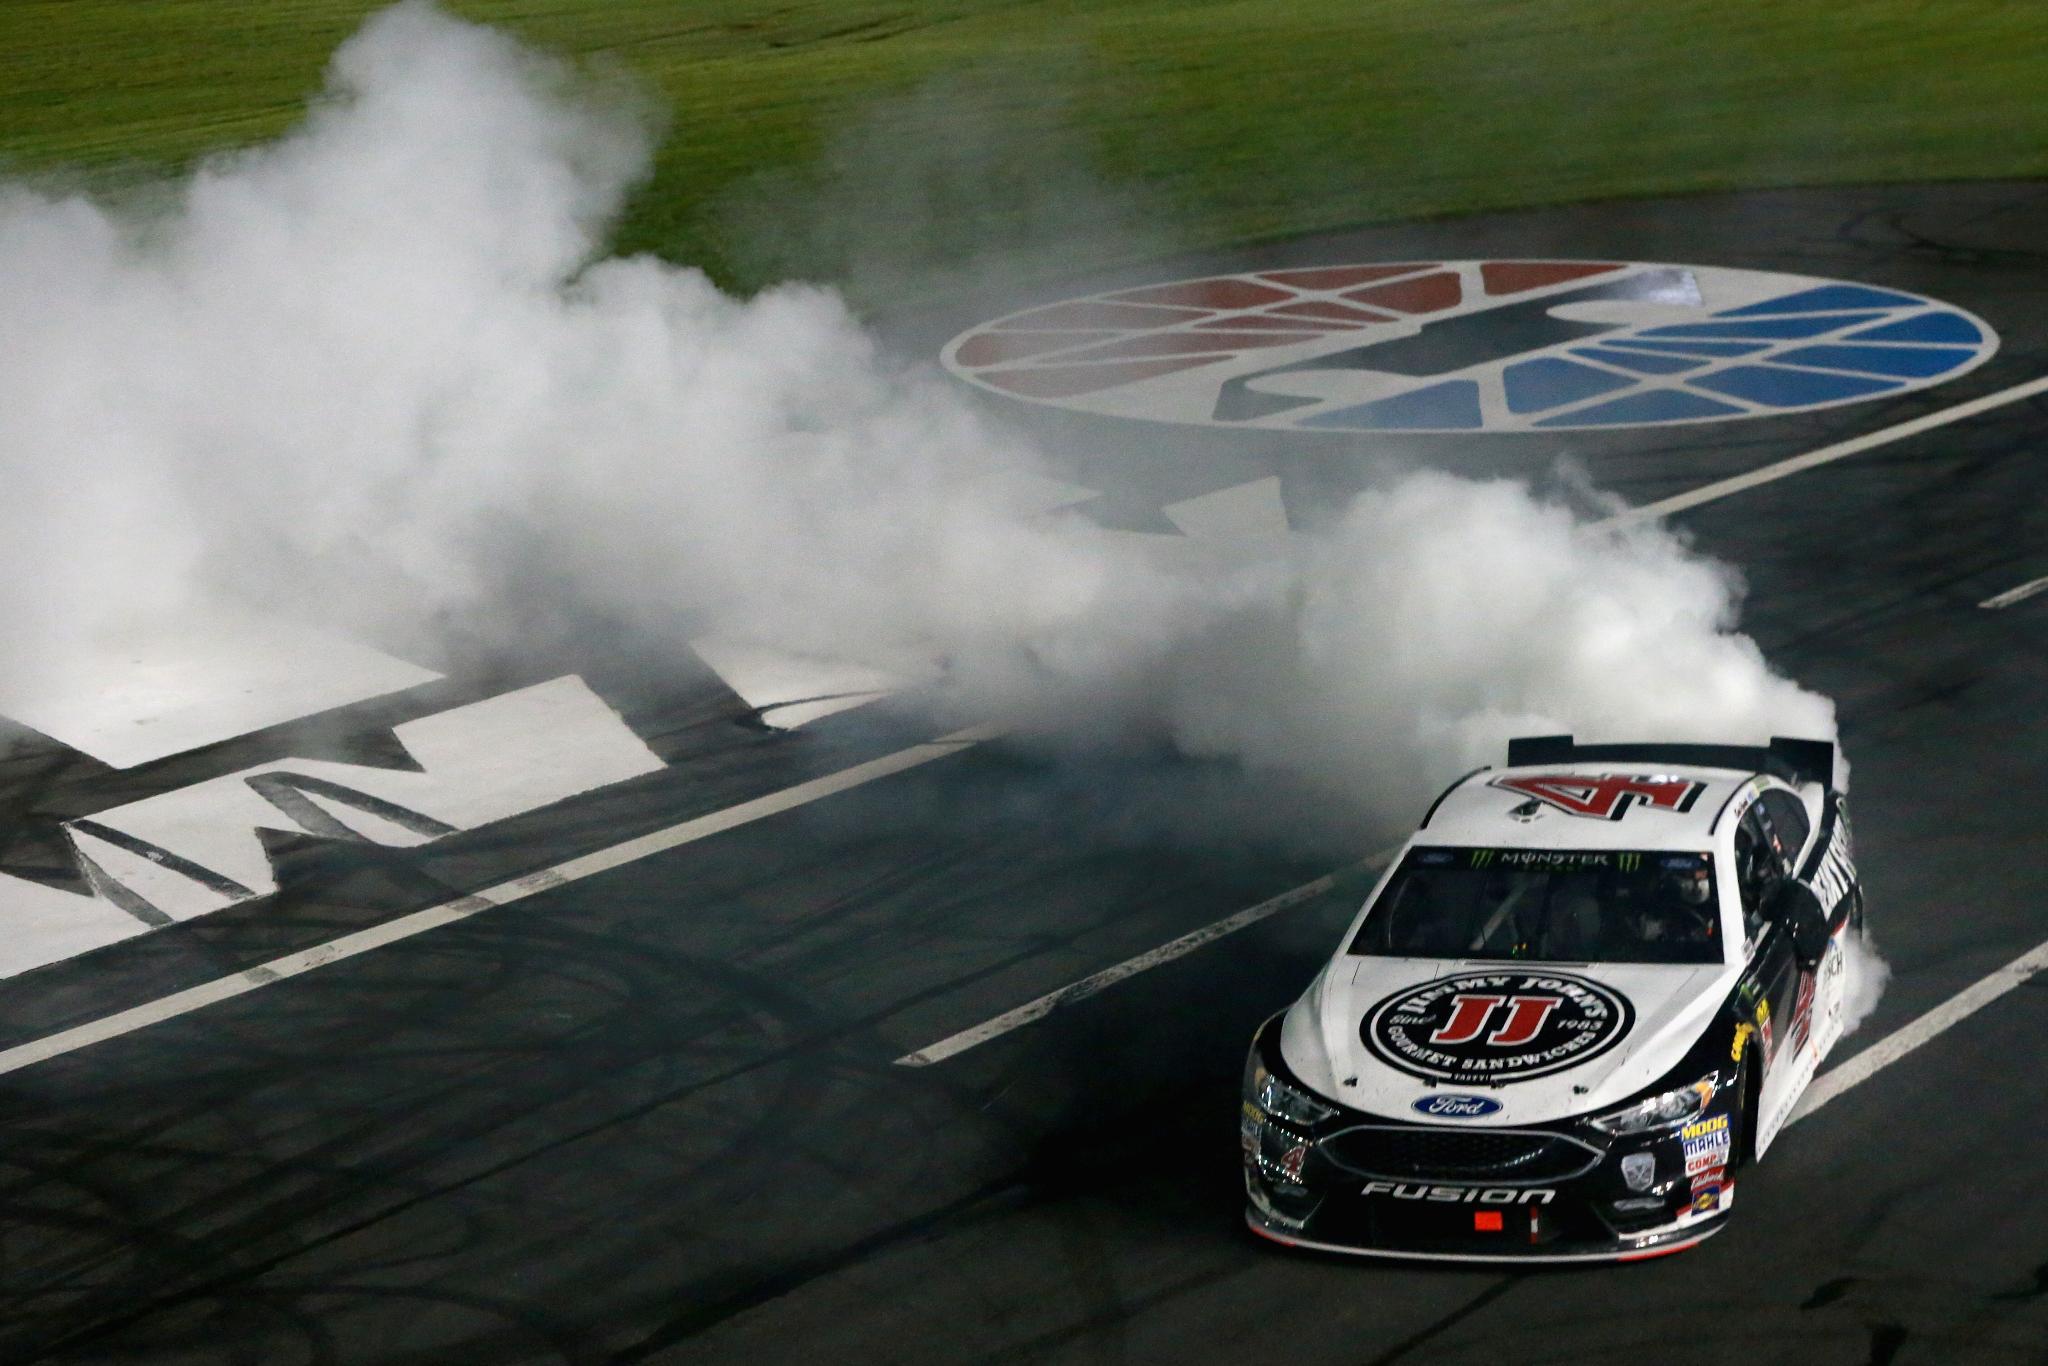
| Kevin Harvick does a celebratory burnout after the NASCAR All Star Race |
| Sean Gardner/Getty Images |
Take a Number: A Loopy 38
There’s a big difference between 38 lead changes and 12…and that difference sparked a little controversy after last month’s NASCAR’s All-Star race. While some shared 38 as the number of lead changes, others stuck to the more conservative dozen. So who’s right…and what’s the difference, really?
Well, they’re both right. The difference comes from using two sets of data: NASCAR’s loop data and more traditional timing and scoring.
Loop data is named for the scoring loops positioned at intervals around every race track. Each car in the race has an electronic transponder located in the same location under the body of the car, and data is recorded by NASCAR at each of those locations, the exact number of which varies by track.
Traditional statistics are recorded differently. For instance, the leader of the race is only scored at the start-finish line, so whichever driver crosses that line first each lap is recorded as the leader. Traditional statistics are the official stats you read after the race, and in last week’s All-Star Race, that translates into 12 lead changes.
The scoring loops, on the other hand, record what happens during each lap. If two drivers are side-by-side for the lead and swap it back and forth on the backstretch and through turns 3 and 4, the scoring loops record who’s ahead at each interval. If the driver who had the lead at the start-finish line last time by keeps the lead, there is no official lead change, despite another driver having passed him briefly.
[adinserter name="GOOGLE AD"] Some people cite loop data as a way for NASCAR to artificially inflate the numbers, and it is easy to see why, on paper, 38 lead changes looks better than 12. Is it deceiving? That’s a matter of opinion. While loop data is largely unofficial, is it inaccurate to say that when drivers pass each other for the lead a few times over the course of a lap, the lead isn’t changing hands. It’s a different set of data, but not incorrect.
So, why not make loop data official? There are a couple of obstacles to that. One, old-school scoring can still be done by hand, as it has been since the 1940s. If a scoring loop fails or a transponder falls off a car, that does cause inaccuracies. By keeping the traditional scoring in place, it alleviates those potential problems.
Also, NASCAR, and auto racing in general, is already a difficult sport to track historically because of changes in technology that make comparisons across eras loose at best. A radical change in scoring would make it impossible. By using both, NASCAR has additional data without compromising historical accuracy.
What kind of data does NASCAR get from the loops, exactly? The most common thing fans see is where the cars are on track when a caution flag flies. NASCAR uses the last scoring loop the leader passed before the moment of caution to determine who’s in front. If teams don’t pit, this also determines who will lead the field back to green.
Other than lead changes, NASCAR measures the following with scoring loops: each driver’s average running position, a composite box score, closers, fastest drivers early and late in a run and on restarts, driver rating, fastest laps, green flag passes, quality passes, green flag speed and laps led.
Confused yet? Let’s take a look at loop data for the Cup Series race at Dover last month. Traditional data lists 17 official lead changes among six drivers. Kevin Harvick was the race winner. We’ll look at his data, and for comparison, data for ninth-place Jimmie Johnson and 20th-place Chris Buescher.
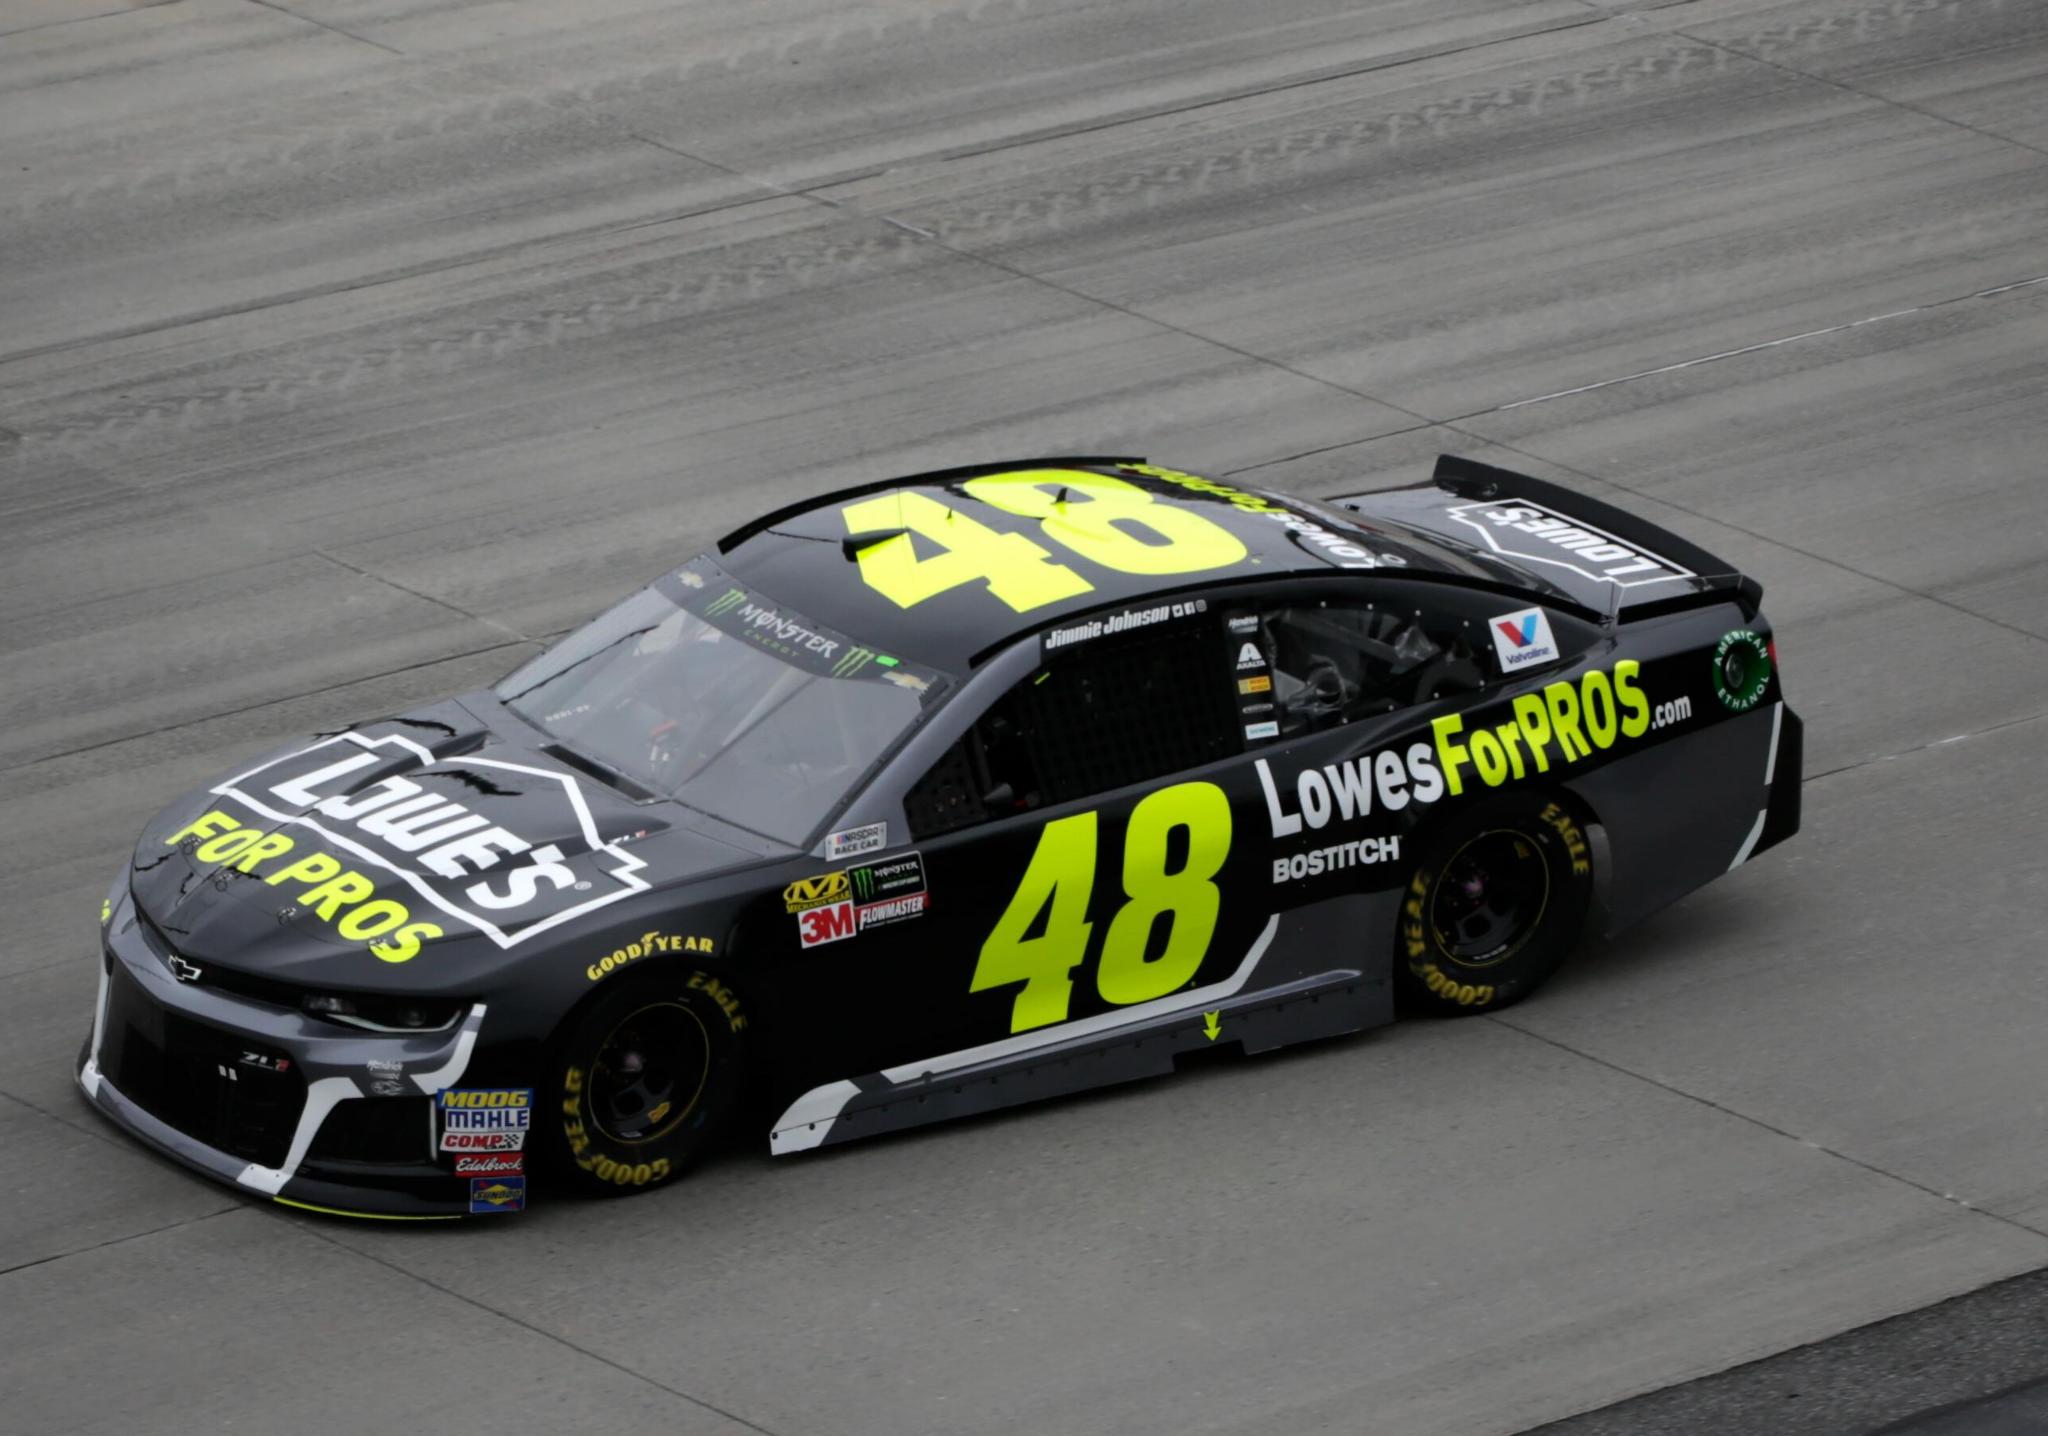 |
| Jimmie Johnson finished ninth at Dover |
| Alan Marler/HHP and General Motors |
Average running position looks at each driver’s position on each lap and draws the average from that. Harvick’s average for 400 laps at Dover was a stellar 2.26, showing the advantage of track position from the start. Johnson, the winningest driver in history at Dover, averaged a 9.08 position, so there was very little variance throughout the race. Buescher’s average was also fairly steady at 20.09. It looks like those drivers all made very few passes during the race, and weren’t passed often. More on that later.
Closer statistics look at how many positions a driver gains in the final 10 percent of a race. Because Harvick led the final 62 laps, he gained zero spots in the final 10 percent of the race, ranking him 10th, like Harvick, Johnson ran in the same spot as he finished during that run, while Buescher lost one position over that time, ranking 33rd in the field.
In that race, no driver lost or gained more than two spots in the final 40 laps; in other races, those numbers can be much higher, depending on the size of the track and whether there’s a caution flag (or several).
Driver rating is figured with a complicated formula that weights finishing position, average running position, average speed and fastest lap, along with bonuses for winning and running in a certain average range. Harvick’s rating at Dover was a stellar 113.9. In contrast Johnson had just an 80.1 (Johnson’s lifetime Dover rating before the race was 118) and Buescher 55.5.
NASCAR calculates driver rating for the season and by track as well as individual races.
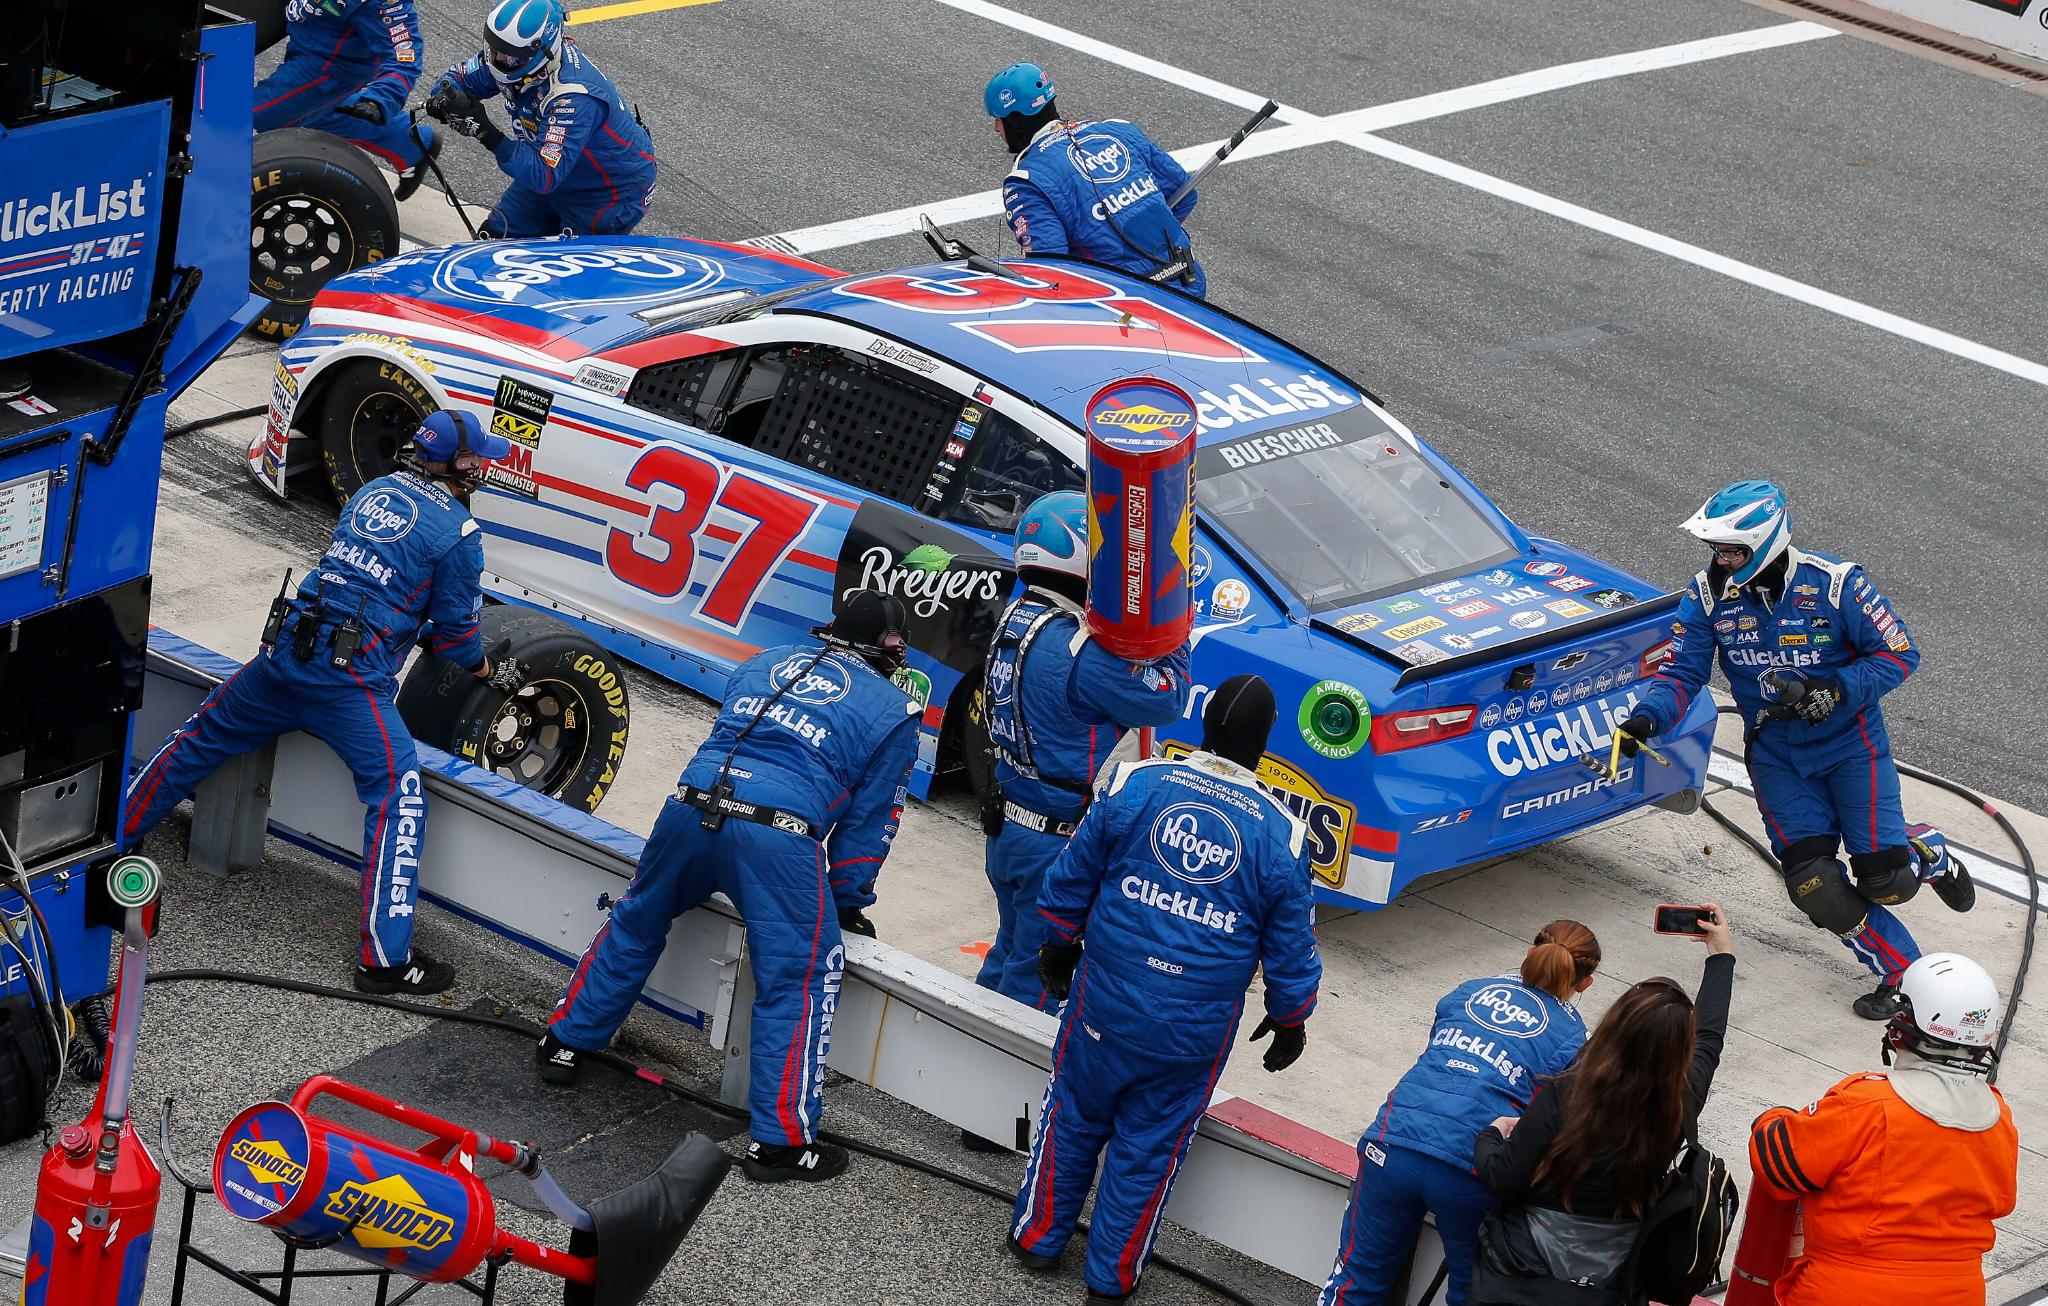 |
| Chris Buescher finished 20th at Dover |
| Ashley R Dickerson/HHP and General Motors |
Average position early and late in a run is just that…over the course of a fuel run, where the driver runs. Buescher’s numbers show his speed dropped off just a bit over a run while Harvick and Johnson gained, Johnson more so at over one mile an hour. Those speeds can affect a driver’s finish if speeds drop off drastically. Differences will vary by track depending on tire wear, as well.
NASCAR also records the drivers who were fastest on restarts, and again Harvick topped the list with a top speed of over 150. Green flag speed ranks drivers’ speed without the slower speeds under caution. Harvick ranked third, but the two drivers before him, Kyle Busch and Corey Lajoie) both did not finish the race, and their average was affected by their shorter days. Johnson was ninth (right where he finished, and Buescher 25th.
Fastest laps measures whether a driver runs the fastest lap at any point during the race. Harvick led a third of the green-flag laps at Dover, and Johnson was fastest for seven circuits. With only 23 different drivers being fastest at some point, Beuscher was not on the list.
Green flag passes count the number of passes the driver makes under green (thank you, Captain Obvious). In contrast to the traditional pass numbers, though, every position change is recorded. This number can look in opposition to the average running position because that can make it look like a driver wasn’t racing for position throughout the race. Harvick was actually the lowest of all three drivers in that category, ranking 30th with 16 passes…mainly because he was the leader for much of the race. Johnson’s 31 passes ranked him 11th (Clint Bowyer led the field with 47) and Buescher had 30, 14th overall.
[adinserter name="GOOGLE AD"] Three drivers were inside the top 15 for every lap at Dover—Brad Keselowski, Chase Elliott and Ryan Blaney. Harvick was in the top 15 for all but one lap and Johnson all but four. Buescher was in that group for just four laps.
Both traditional and loop statistics list laps led, and they’re the same thing either way. Only six drivers led at Dover, with Harvick leading 201, Neither Johnson nor Buescher led a lap that week.
The final loop data piece is quality passes. Those are defined as passes made for position while running in the top 15 under caution—in other words passes that have the most impact on the outcome of the race. Johnson was second on the list with 28 (Ricky Stenhouse Jr. set the standard with 31). All 16 of Harvick’s green-flag passes were also considered quality, good for 12th in the field. Buescher posted just two…indicative of him running outside the top 15 for most of the day.
These numbers can certainly be manipulated to make races seem more exciting than many fans think they were, but they are also indicative of how much action went on throughout every race, and are useful for comparison between tracks as well as between drivers and of drivers over time. There are too many variables for loop data to replace official numbers, and those numbers are too important to scrap anyway. But neither are wrong…it’s all in the use and interpretation.