IndyCar: Total TV Viewership up slightly in 2023
NBC Sports’ 2023 coverage of the NTT INDYCAR SERIES delivered the most-watched INDYCAR season in 12 years – with and without streaming.
Since 2011, it was NBC Sports’ most-watched season on record, and the most-streamed season ever.
The 2023 NTT INDYCAR SERIES season, headlined by Alex Palou’s second career series championship and Josef Newgarden’s Indy 500 victory, averaged a Total Audience Delivery (TAD) of 1.32 million viewers across NBC, USA Network, Peacock and NBC Sports digital platforms. This ranks as the most-watched season for the INDYCAR SERIES since 2011 (1.39 million viewers, NBCSN/ABC) and the best in NBC Sports history, up 2% vs. last year’s then-record viewership (1.30 million viewers, NBC/USA Network/NBC Sports Digital). TAD is based on data from Nielsen and Adobe Analytics.
Half of the season’s 16 races on television delivered a TAD of more than 1 million viewers, tying last year for the highest mark since 2008. NBC’s 13 races posted a TAD of 1.47 million viewers, up 4% vs. last year’s coverage on NBC (1.42 million, 14 races).
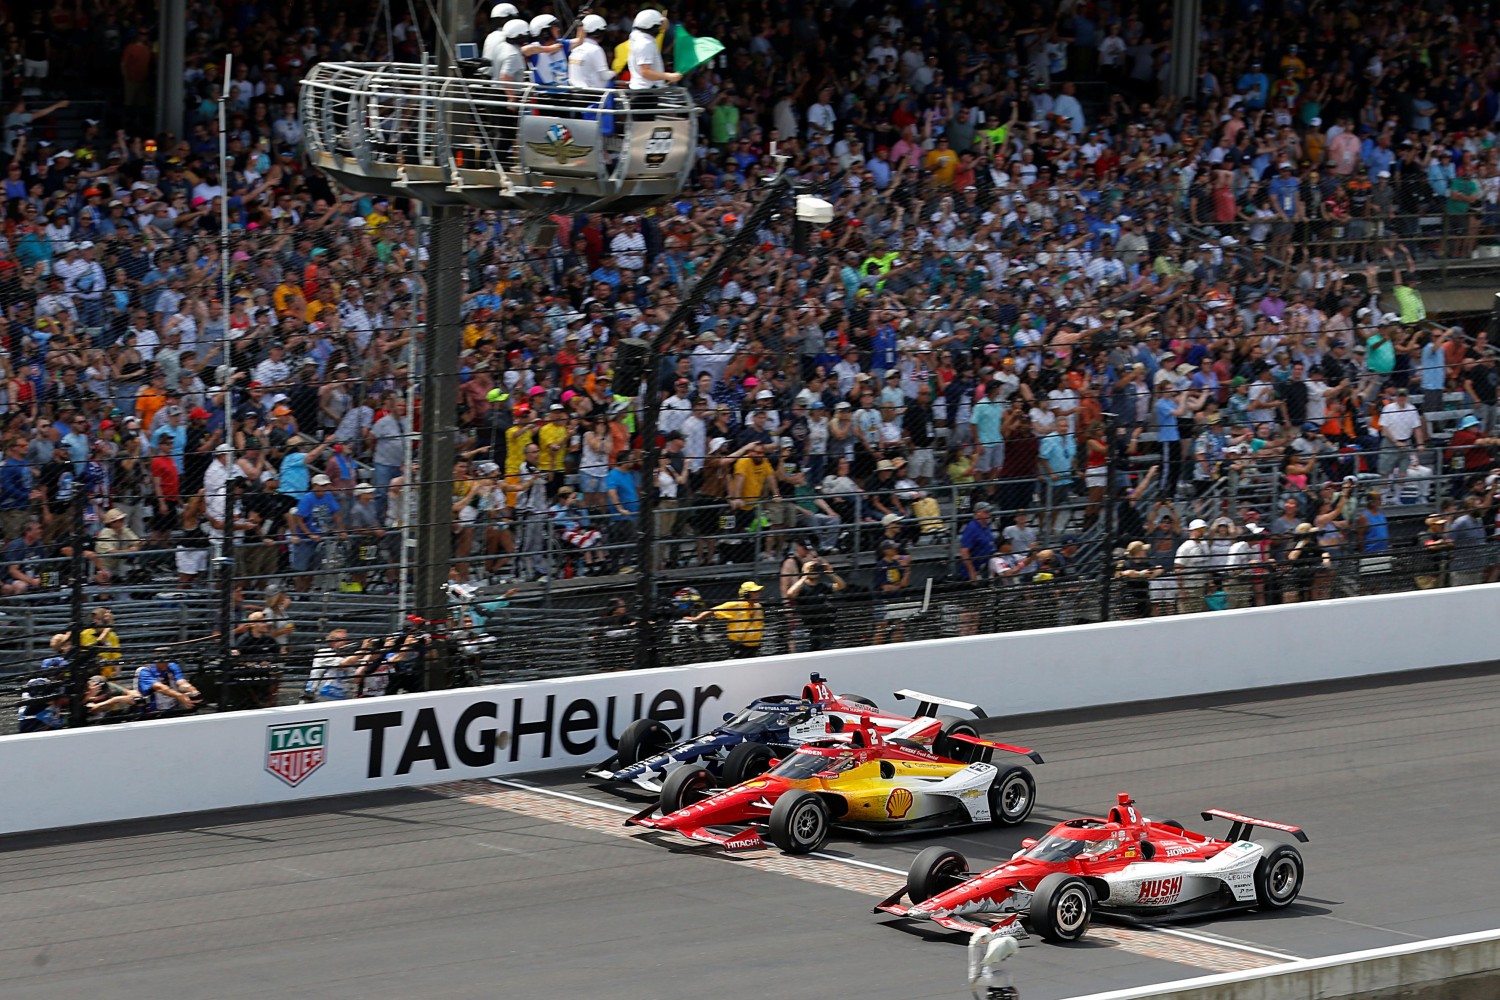
Overall viewership was led by the 107th Running of the Indianapolis 500, which delivered a TAD of 4.93 million viewers across NBC and Peacock. The race also had a 13 share (percentage of homes watching television at the time of the race), its best in 15 years (2008; 13 share).
Led by comprehensive streaming coverage on Peacock, including the platform’s exclusive presentation of the Honda Indy Toronto on July 16, the 2023 season ranked as the most-streamed INDYCAR season on record with an Average Minute Audience (AMA) of 58,000 viewers, up 15% vs. 2022.
Locally, Indianapolis led all markets with a 3.26 rating for the season. Following are the Top 10 markets for the 2023 NTT INDYCAR SERIES season.
| RANK | MARKET | RATING |
| 1 | Indianapolis | 3.26 |
| 2 | Knoxville | 1.82 |
| 3 | Louisville | 1.52 |
| 4 | Greenville | 1.39 |
| 5 | Ft. Myers | 1.36 |
| 6 | Dayton, OH | 1.30 |
| 7 | Milwaukee | 1.23 |
| 8 | Cincinnati | 1.20 |
| 9 | Detroit | 1.18 |
| 9 | Richmond-Petersburg | 1.18 |
–NBC SPORTS–
TV data only (Excludes Streaming Data)
The all-important 18-49 year old viewership continues to plummet year over year.
2021 to 2022: down 6.07%
2022 to 2023: down 13.6%
IndyCar Avg 18-49 Age Group Viewership in 2023: 17.9% (a death knell)
F1 Avg 18-49 Age Group Viewership in 2023: 42%
Total IndyCar TV Viewership 2022 to 2023: Up 5.0%
Average IndyCar USA TV Viewership Per Race: 1,058.647 (Much better than the NBCSN days)
Average F1 USA TV Viewership Per Race (2023 to date): 1,240,000
Average F1 Global TV Viewership Per race (2023 to date): 72 million
| Venue | 2021 Network | 2021 Rating | 2021 Viewers | 2021 18-49 | 2022 Network | 2022 Rating | 2022 Viewers | 2022 18-49 | 2023 Network | 2023 Rating | 2023 Viewers | 2023 18-49 |
| St. Pete | NBC | 0.77 | 1,219,000 | 290,000 | NBC | 0.89 | 1,405,000 | 337,000 | NBC | 0.76 | 1,189,000 | 216,000 |
| Barber | NBC | 0.59 | 914,000 | 257,000 | NBC | 0.59 | 920,000 | 193,000 | NBC | 0.57 | 930,000 | 178,000 |
| Long Beach | NBCSN | 0.21 | 368,000 | 78,000 | NBC | 0.64 | 1,055,000 | 294,000 | NBC | 0.61 | 1,026,000 | 193,000 |
| Indy GP | NBC | 0.64 | 1,024,000 | 229,000 | NBC | 0.60 | 998,000 | 232,000 | NBC | 0.46 | 715,000 | 120,000 |
| Indy 500 | NBC | 3.15 | 5,547,000 | 1,125,000 | NBC | 2.69 | 4,618,000 | 914,000 | NBC | 2.65 | 4,710,000 | 734,000 |
| Detroit 1 | NBC | 0.53 | 842,000 | 193,000 | – | – | – | – | – | – | – | – |
| Detroit 2 | NBC | 1.11 | 1,383,000 | 363,000 | USA | 0.23 | 354,000 | 94,000 | NBC | 0.65 | 1,047,000 | 177,000 |
| Texas 1 | NBCSN | 0.22 | 358,000 | 77,000 | NBC | 0.62 | 954,000 | 211,000 | NBC | 0.53 | 830,000 | 178,000 |
| Texas 2 | NBCSN | 0.24 | 407,000 | 98,000 | – | – | – | – | ||||
| Elkhart Lake | NBCSN | 0.47 | 800,000 | 164,000 | NBC | 0.69 | 1,087,000 | 208,000 | USA | 0.23 | 385,000 | 84,000 |
| Toronto | Peacock | Not Published – too embarrassingly low | ||||||||||
| Iowa 1 | – | – | – | – | NBC | 0.61 | 941,000 | 186,000 | 0.70 | 1,121,000 | 240,000 | |
| Iowa 2 | – | – | – | – | NBC | 0.45 | 719,000 | 114,000 | 0.60 | 1,055,000 | 180,000 | |
| Mid-Ohio | NBC | 0.87 | 1,298,000 | 295,000 | NBC | 0.57 | 877,000 | 213,000 | USA | 739,000 | 100,000 | |
| Nashville | NBCSN | 0.68 | 1,200,000 | 288,000 | CNBC | 0.09 | 121,000 | 24,000 | NBC | 0.70 | 1,113,000 | 195,000 |
| Indy GP 2 | NBCSN | 0.30 | 502,000 | 141,000 | NBC | 0.67 | 1,046,000 | 233,000 | USA | 0.30 | 556,000 | 104,000 |
| Gateway | NBCSN | 0.25 | 434,000 | 103,000 | USA | 0.34 | 553,000 | 138,000 | NBC | 0.60 | 1,090,000 | 254,000 |
| Portland | NBC | 0.43 | 666,000 | 124,000 | NBC | 0.61 | 979,000 | 208,000 | NBC | 0.60 | 953,000 | 189,000 |
| Laguna Seca | NBC | 0.44 | 715,000 | 179,000 | NBC | 0.32 | 507,000 | 137,000 | NBC | 0.33 | 538,000 | 85,000 |
| Annual Total | 17,677,000 | 4,004,000 | 17,139,000 | 3,737,000 | 17,997,000 | 3,227,000 | ||||||
| % Chg ’20 to ’21 | 51.1% | 5,977,000 | % Chg ’21 to ’22 | -3.0% | -538,000 | % Chg ’22 or ’23 | +5.0% | +858,000 | ||||